

Companion to Marketers of Catan.
On August 6, Nielsen agreed to buy DoubleVerify for $2.15 billion in cash, which puts the panel company that prices television inside the same walls as the verification company that measures 9.5 trillion media transactions a year.[1] A deal that size usually gets filed under consolidation, but the pattern of the last eighteen months says something more specific: the two camps that measure advertising have been buying each other’s signal.
DoubleVerify moved first, paying $85 million in February 2025 for Rockerbox, whose products are multi-touch attribution, marketing mix modeling and incrementality testing, which means the impression camp wrote a check for the traditional camp’s tools.[2] The same month, T-Mobile closed a $600 million purchase of Vistar Media, the leading platform for digital out-of-home advertising, and a month later T-Mobile added Blis for $175 million.[3] T-Mobile sells advertising against its own subscriber identity data, and its release explains what the company bought instead:
“Blis is a radically different advertising platform that structures data based on geography rather than identity.”
T-Mobile, March 5, 2025[3]
Then Nielsen bought the impression camp’s flagship outright, and the four deals that cross the camp line add up to $3.0 billion in eighteen months, every dollar of it spent on the signal the buyer’s own camp cannot produce.
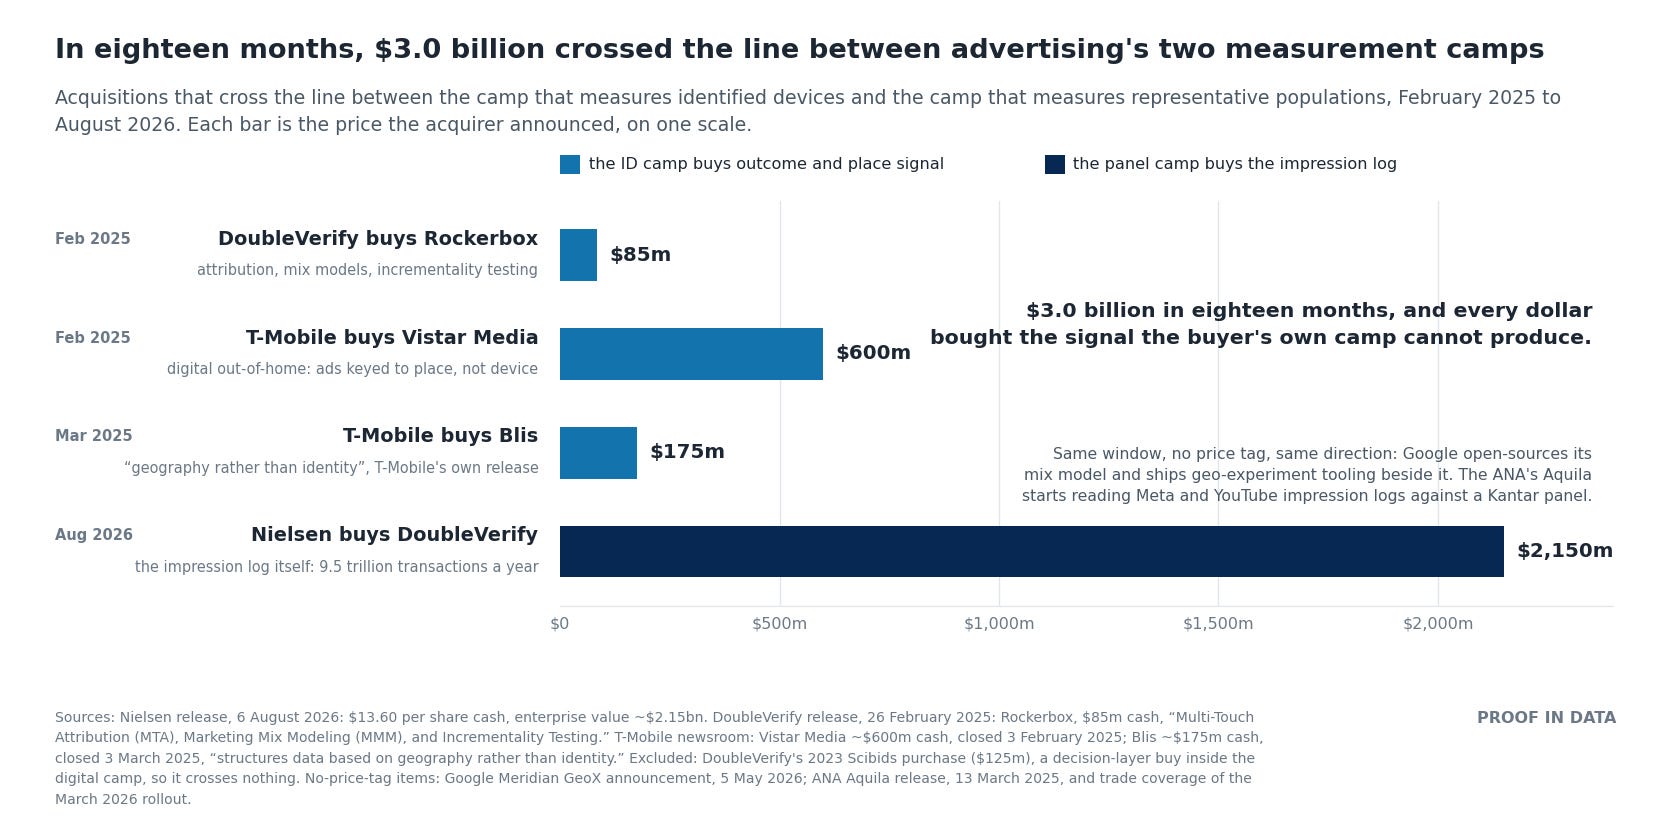
The methods are not joined but the companies are merged instead.
The moves without price tags point the same way. Google gives Meridian, its marketing mix model, away as open source, and this spring Google shipped GeoX beside it: tooling that runs the geo experiments the model calibrates against, also free.[4] And Aquila, the measurement company the ANA built on the industry’s open-source Halo architecture, began its commercial rollout this spring reading impression-level records from Meta and YouTube alongside linear television, calibrated against a single-source panel Kantar is growing toward 5,000 homes.[5] When walled gardens hand their impression logs to a panel-calibrated, census-weighted measurement system, one camp is adopting the other’s frame voluntarily.
The money, in other words, is merging what the methods never did, and to see why the methods could not merge on their own you need a better classification than the one the industry argues with.
The frame is one column short
When I argue for geo-temporal measurement in the standards threads, the pushback arrives in a two-word frame: deterministic versus probabilistic. Identity-based measurement sits on the deterministic side, geographic measurement sits on the probabilistic side, and the debate ends before it starts, because nobody wants to defend “probabilistic” to a CFO.
Measurement methods differ on three properties, and the three are independent. How a method joins records: is the link between an ad and an outcome directly observed or inferred? How a method infers: what turns joined records into a claim that the ad caused the outcome? And what frame a method covers: is the population in the data the population you sell to, or a slice of it? Picture a table with one row per measurement method and those three properties as its columns, the join, the inference and the frame; the matrix in the middle of this piece fills in ten rows. Deterministic describes the join column at best. Probabilistic describes the inference column, always, for every method on the market. And representative describes the frame column, which is the property the debate never names and the property that decides it.
The classification applies twice, because measurement has two halves: ad impact is who the media reached, and conversions are what happened afterward and because of what. A method can sit in different boxes for each half, and most methods do.
The deterministic seed
What “deterministic” actually describes in 2026 is a seed rather than a system. The seed is the set of directly observed links, the logged-in user and the matched email, and everything beyond the seed is an expansion that arrives modeled. The practitioners who say deterministic are describing the seed, while the number on the dashboard describes the expansion.
The vendors document this themselves; you only have to read their own pages. When a user declines consent, Google Ads estimates the conversion path it can no longer observe and puts the estimate in the same Conversions column as the observed ones, flowing into every downstream report with no modeled-versus-observed split. Google’s launch material says the modeling recovers more than 70 percent of the ad-click-to-conversion journeys lost to consent choices, and its own documentation notes that consented users are two to five times more likely to convert than unconsented users, which is the selection bias the model has to correct for, stated by the vendor.[6] Google Analytics models the behavior of cookie-decliners from the behavior of cookie-accepters and blends the result into reports, which the product marks with a small icon. Google excludes the modeled rows from the BigQuery export, so the interface and the raw export of the same product disagree by design.[7]
Meta made the same move after App Tracking Transparency. Its reported iOS underreporting gap went from about 15 percent to about 8 percent in months, and the gap closed through conversion modeling, not through recovered observation.[8] Apple’s SKAdNetwork framework degrades attribution on a crowd-anonymity ladder: below volume thresholds the conversion value in the postback simply arrives as null, and later postbacks carry only coarse buckets.[9] Chrome’s Attribution Reporting API is the purest case in the set, because the spec is public: with a small probability the browser deliberately sends a report drawn at random from the possible outcomes, including conversions that never happened.[10] The fabrication is a privacy feature, and the feature makes the point better than I can: the browser converts the deterministic event into a probabilistic report on purpose, before anyone measures anything.
The identity graphs underneath the ecosystem run the same architecture. LiveRamp’s own material describes probabilistic methodology as the thing that adds “value and scale” on top of a deterministic core: observed links seed the graph, inferred links extend it.[11] And when researchers have tested the output end to end, the results are sobering. A 2019 study in Marketing Science tested audience data from 19 brokers and found gender, a binary attribute the industry has bought and sold for decades, averaged 42 percent accuracy, which is worse than a coin.[12]
The seed is also shrinking. Safari and Firefox have blocked third-party cookies by default for years, which removes roughly a fifth to a quarter of browsing from the cookie-matched world before anyone opts out of anything. On iOS, App Tracking Transparency opt-in rates range from roughly 14 percent to roughly 50 percent depending on whose methodology you accept, and that four-fold spread is its own finding: the industry cannot even measure its measurement loss deterministically.[13]
Nobody delivers individuals anyway
There is a second fact about the deterministic camp that deserves more attention than it gets: the outputs are cohorts. Every major clean room enforces a minimum crowd size on what it returns. LiveRamp will not release data that identifies a group smaller than 25 people. Google’s Ads Data Hub requires roughly 50 unique users behind each row of results and silently removes the rows that fail the check. Amazon Marketing Cloud requires 100, and sub-threshold rows vanish without an error message. InfoSum defaults to 100. Activation has floors too: Google Customer Match wants 100 active users before ads serve against a list.[14]
These thresholds are good privacy engineering, and I am not criticizing them; I am pointing at what they mean for the debate. The deterministic pipeline observes individuals, then aggregates them into small anonymous crowds before any buyer sees a number. The pipeline collects individual-level truth and then deliberately withholds it. So the practical output of deterministic measurement is an aggregate, exactly like the output of geographic measurement. The difference is the size and honesty of the aggregate: a clean room hands you a crowd of 50 drawn from its matched slice, and a geographic cell hands you a declared population drawn from a census.
The frame column
The frame column is the one the two-camp debate never fills in. A platform measures its universe: its logged-in users and its matched records. Everything the platform tells you is conditioned on membership in that universe, and membership is not random. Rick Bruner has made this argument for years from the experimental side, and his Central Control design guide states the operational consequence plainly: when you try to match exposed audiences to outcome data, typical match rates run 50 to 60 percent, and even at 80 percent the noise swamps the 1-to-5 percent effects advertisers need to detect. His phrase for user-level tracking is “false precision.”[15]
The geographic frame has the opposite character. A designed geo experiment uses all 210 United States media markets, mutually exclusive and collectively exhaustive, with ZIP-coded sales as the outcome. No match step exists, so no match bias exists. The result projects to the national campaign because the frame is the nation. The inference is openly probabilistic, a lift estimate with a confidence interval, and the experiment declares one more honest thing: it measures which markets were intended to receive the ads, not which individuals saw them. The trial design calls that intent-to-treat and declares it upfront. Compare that declaration to a pipeline that observes individuals, models the majority it cannot observe, aggregates the rest into crowds, and reports the blend as a whole number.
The traditional camp pays for its honesty in resolution. The average United States media market covers 43,560 square kilometres, and behind the television numbers a panel directly measures 101,000 people in 42,000 homes and projects them onto everyone else.[16] The frame is representative and census-weighted, and the reporting is coarse, which is exactly the weakness the digital camp’s trillions of logged records could repair if the two signals could be written on the same frame.
Every honest pipeline ends at the census
Watch what the digital camp does when it wants its numbers to be believed, because the tell is always the same: the camp weights its universe back to the census. Aquila is the clearest example on the ledger: the platforms hand over impression-level records, the records land against a designed panel, and the panel’s job is to correct the platforms’ universes to the population. The panel is small and expensive and recruited to be representative, which is precisely the property the impression logs lack at any size.[5]
Nielsen’s own architecture made the same concession years ago: big-data households from set-top boxes and smart TVs, calibrated by the measured panel, because set-top homes are not average homes. The industry name for this move is calibration, and calibration is a polite word for confessing your frame and repairing it with someone else’s.
The part the dashboards do not show is that the repair gets harder as the seed shrinks. A weight is a model, and the fewer observed people a slice contains, the larger the weight each one carries and the more the estimate leans on the model rather than the observation. Digital measurement is walking toward the census frame because its observed slice is shrinking under privacy law and platform policy, and weighting to census is the last claim to market coverage it has left. The camps are converging because each camp is running out of what the other has.
The matrix
Here is the classification applied to the methods on the table. Read each row twice, once for ad impact and once for conversions.
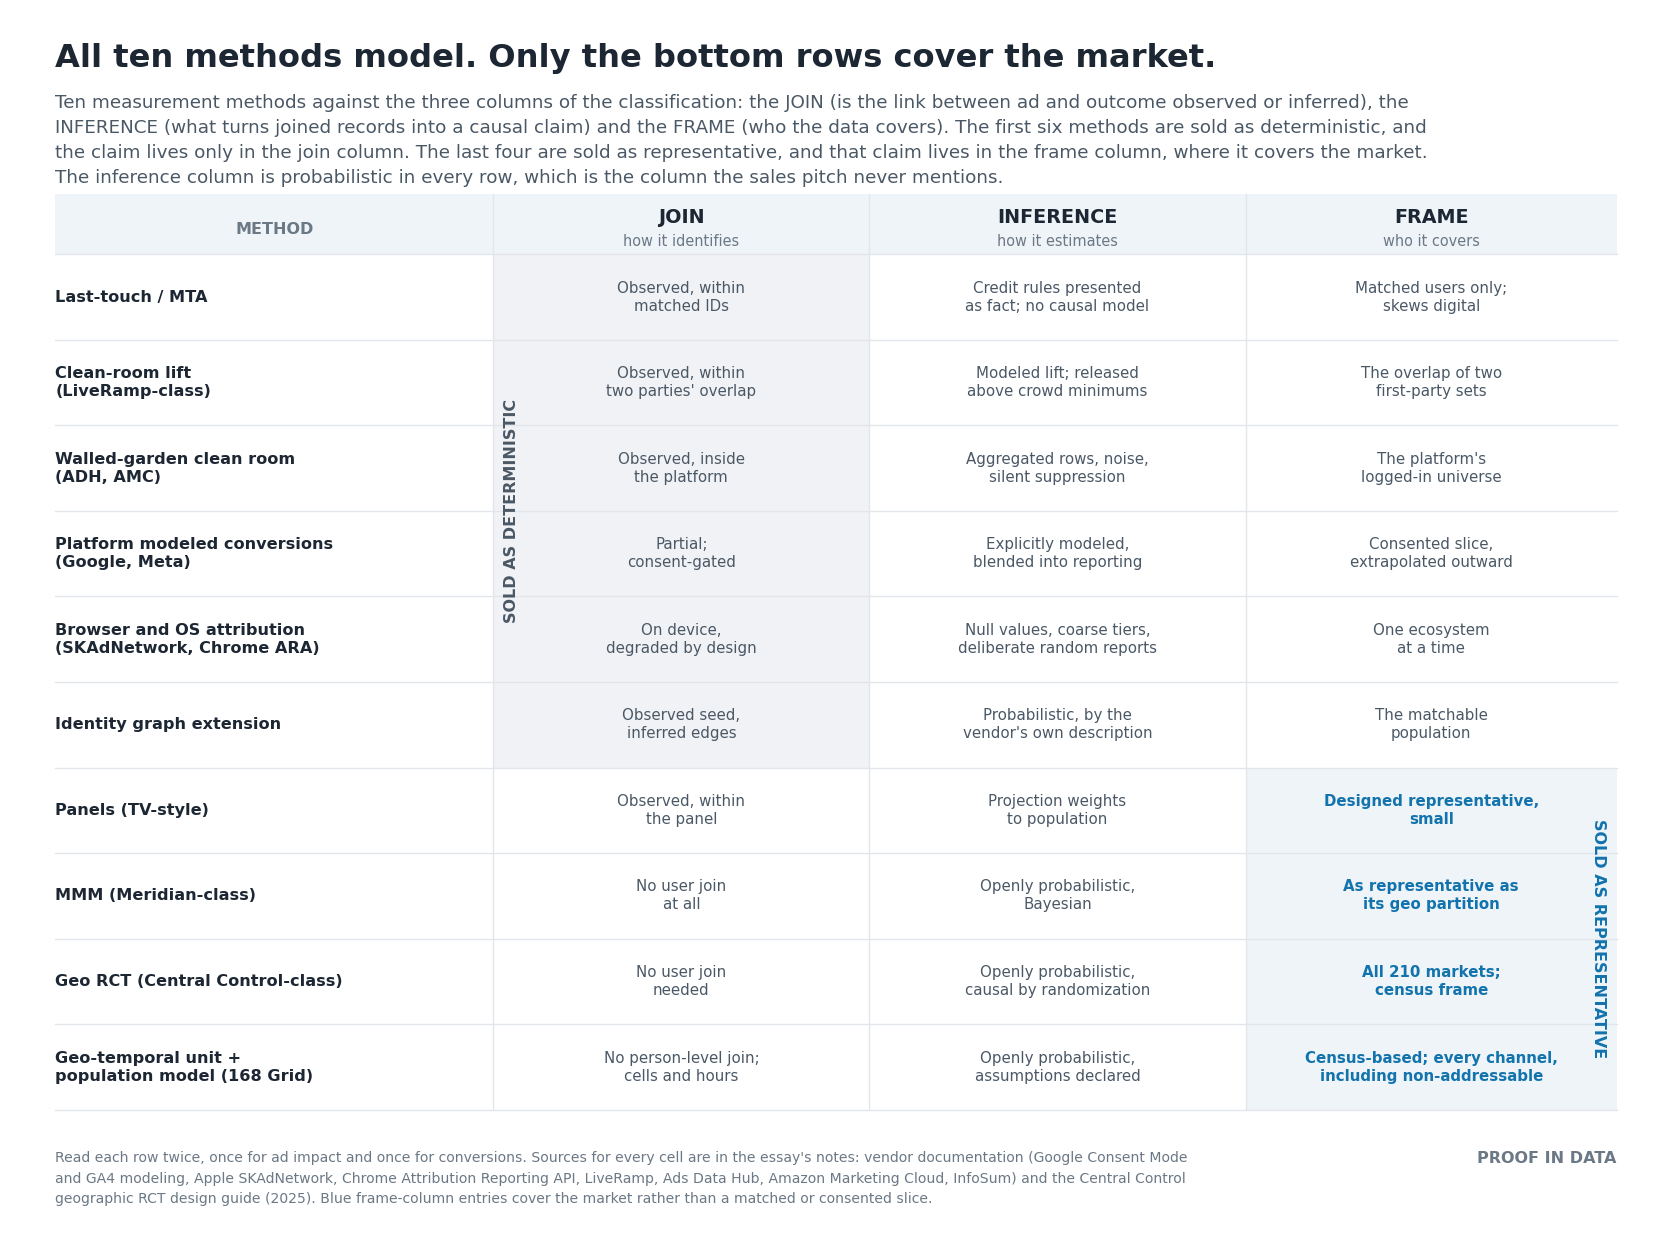
Two patterns fall out of the table. First, the inference column is probabilistic in every row. The methods differ in where the modeling happens and whether anyone tells you, not in whether it happens. Second, only the bottom rows put a check in the frame column, and the rows that are strongest on representativeness are the rows that gave up the person-level join entirely. That is not a coincidence: the join is what restricts the frame, and giving up the join opens the frame to the whole market, including the media no identifier will ever reach.
Panels deserve a sentence of respect here, because television measurement solved the frame problem a half-century ago: recruit a small sample deliberately designed to represent the population, observe it deterministically, and project. The panel row is honest in all three columns. Its weakness is size and cost, which is exactly what a census-grade geographic frame fixes.
Read the ledger against the matrix and every acquisition on the chart turns out to be a company in a top row buying a company in a bottom row, or the reverse: DoubleVerify, a top-row business to its core, bought the bottom-row methods in Rockerbox, while Nielsen, whose panel is the industry’s strongest entry in the frame column, bought the top row’s biggest log.
The models doing the buying math are not LLMs
The machinery deserves a word of its own, because it is the thread that runs through everything I write here. The AI deciding where advertising money goes is not a language model but the marketing mix model that splits a budget across channels, the bidder that prices an impression in milliseconds, the estimator that reads a geo experiment, and the population model that projects a panel onto a country. Every method in the matrix is one of these models sold under a product name, and every deal on the ledger is a company buying a model it does not have, plus the data that model reads.
Jay Friedman raised the commercial version of this within hours of the Nielsen announcement: the traditional Nielsen buyer and the traditional DoubleVerify buyer are different people, probably not even on the same team, and the combined company will have to tell a compelling story before either one cares.[17] He is right, and the split runs deeper than sales territories: one buyer prices audiences with a rating, the other polices delivery with a viewability rate, and neither number converts into the other. Housing the two products in one company does not hand those two buyers one question, because only a shared data model does that.
The machinery is also why the merger wave cannot finish the job on its own. An acquisition can put a panel estimator and an impression classifier in the same building, because both models watch the same event, the ad delivery, and share a key to reconcile on. An outcome is different: a sale happens at a place and an hour, to somebody the advertiser may never identify, and no acquisition has ever produced a key that joins a sale to an impression. What a sales file, an impression log and a panel estimate do share is place and hour, which is the ground I work on with Ether Data, through the 168 Grid. The remaining half is representation: joining a place-and-hour record to a device record without a match key means representing both as vectors, numeric fingerprints a model compares directly, and nobody has shipped that representation yet. The representation half is open.
Digital has not reciprocated
Step back to the paradigm, because the deal and its two buyers are a case study in where AI actually pays. Pointing AI at the jobs the industry already does, cheaper attribution and faster mix models, unlocks very little; the gain is in widening the surface the models can reach, and in measurement the widest surface on the table is the mashup of the two camps: digital and traditional signal written on the same data models, each able to cross-reference the other.
The industry has been building that from one side only. The cross-media program the World Federation of Advertisers’ members designed, the architecture Aquila now runs commercially, is traditional measurement getting more digital: impression logs flowing into a panel-calibrated frame.[5] Digital has not made the reciprocal move: when digital measurement needs geography and time it still borrows traditional’s units, the media market and the week, and those units are built for traditional’s tempo. A market averages 43,560 square kilometres, a week holds 168 hours, and units that size support a handful of simultaneous experiments read weekly, while digital’s advantage runs at the opposite tempo: many small, diverse experiments with feedback loops tight enough to steer a live campaign. The country holds 210 media markets, but at city, town and neighbourhood scale a hexagonal grid holds 24,051, 109,451 and 341,003 cells with fifty or more residents in them, and the difference between 210 experimental units and 341,003 is the difference between running an experiment and running a portfolio of them.[18]
That is why the proposal I keep making in the standards threads is a low-level pair digital can own: H3, a hexagonal grid with nested resolutions, as the unit of geography, and the UTC hour as the unit of time. Low-level is the point: a cell rolls up to a postal code or a media market, an hour rolls up to a broadcast day or a week, and every report traditional already runs survives the rollup, because aggregation only works in one direction. Finer records always roll up to a coarser answer, and a market-week never rolls down into anything. The time half has already landed: the protocol the buying agents are being built on settled its base unit of time on the UTC hour in July.[19]
What to do with this
The two-word frame will keep coming back, because deterministic is a comfortable word to say to a CFO, but the honest sentence under all of this is a short one: every method models. The vendors’ own documentation says so, and their acquisitions now say the rest, because the camp with the records is buying the frame and the camp with the frame is buying the records. The question that separates methods is not whether they model, but whether the frame under the model is the market or a slice of it, and whether the modeling is declared or blended into a whole number. Pick the methods that model in the open, on a frame that covers everyone you sell to, because the money is already choosing them.
Thank you to Chris Williams, whose geo-temporal and population-model arguments run through this piece, and to Rick Bruner, whose geographic experiment design guide is the source for the match-rate and representativeness evidence.
About me
I am Nate Woodman. I have spent twenty years building through ad tech’s platform shifts: one of the first agency trading desks, people-based identity as Chief Data Officer at Havas Media, incrementality experiments I started at IPONWEB so advertisers could optimize to the KPIs that drive their business, and now agent-operated go-to-market systems.
I am available for Fractional CBO and CPO engagements and for agentic GTM implementation, and I am open to the right full-time senior role. The fastest way to reach me is to book time directly. The longer story is at proofindata.com/work-with-me.
Sources
Nielsen, “Nielsen to Acquire DoubleVerify, Creating a Leading, Independent Media Intelligence Platform,” August 6, 2026: $13.60 per share in cash, enterprise value approximately $2.15 billion, a 30% premium to DoubleVerify’s 60-trading-day volume weighted average price as of August 5, 2026; expected close in the first quarter of 2027. DoubleVerify measured 9.5 trillion billable media transactions in full-year 2025 (DoubleVerify Q4 and FY2025 results, February 26, 2026).
DoubleVerify, “DoubleVerify To Acquire Rockerbox, Adding Outcome Measurement and Attribution Capabilities,” February 26, 2025: a cash transaction valued at $85 million; Rockerbox’s platform described in the release as “Multi-Touch Attribution (MTA), Marketing Mix Modeling (MMM), and Incrementality Testing.” DoubleVerify had previously acquired Scibids, described in its July 31, 2023 release as AI-powered digital campaign optimization, for $125 million in cash and stock; that deal closed September 14, 2023 and stayed inside the digital camp, so it is not counted in the $3.0 billion.
T-Mobile newsroom: Vistar Media, approximately $600 million in cash, announced January 13, 2025, closed February 3, 2025; Blis, approximately $175 million in cash, closed March 3, 2025. The Blis quote is from T-Mobile’s March 5, 2025 release, in full: “Blis is a radically different advertising platform that structures data based on geography rather than identity, linking real-world actions to digital behaviors.”
Google’s Meridian marketing mix model has been open source and generally available since January 2025; Google announced the GeoX geo experimentation tooling and Meridian Studio on May 5, 2026.
ANA, “ANA Aquila LLC Achieves Major Breakthroughs,” March 13, 2025: Aquila “is deploying the Halo open source cross media measurement architecture”; Kantar Media’s single-source calibration panel installed in more than 1,000 homes with plans to expand to 5,000; collaboration with Amazon, Google, Meta and TikTok; launch targeted early 2026. Commercial rollout began in spring 2026, with phase one reading impression-level data from Meta, YouTube and linear television (MediaPost, March 27, 2026).
Google Ads Help, “About conversion modeling through Consent Mode” (support.google.com/google-ads/answer/10548233), and Google’s Consent Mode launch material: modeling “recovers more than 70% of ad-click-to-conversion journeys lost due to user cookie consent choices”; “Consented users are typically 2-5x more likely to convert than unconsented users.”
Google Analytics Help, “Behavioral modeling for consent mode” (support.google.com/analytics/answer/11161109); modeled data is excluded from the BigQuery export.
Meta’s reported iOS underreporting moved from approximately 15 percent to approximately 8 percent through conversion modeling (Graham Mudd, Meta VP Product Marketing, via AdExchanger, 2021).
Apple, SKAdNetwork documentation: crowd anonymity tiers, conditional conversion values, null postback values below thresholds, coarse-only later postbacks (developer.apple.com/app-store/ad-attribution/).
Chrome Attribution Reporting API specification, event-level reports (github.com/WICG/attribution-reporting-api, EVENT.md): randomized response with probability p, 0.24% for clicks, under which the browser reports a randomly chosen output state.
LiveRamp documentation and blog: probabilistic methodologies “add value and scale when applied within an identity solution that has a core deterministic foundation.”
Neumann, Tucker and Whitfield, “Frontiers: How Effective Is Third-Party Consumer Profiling? Evidence from Field Studies,” Marketing Science 38(6), 2019: across 19 data brokers, gender accuracy averaged 42.3 percent, range 25.7 to 62.7.
Cookieless-by-default browsing (Safari, Firefox, Brave) is roughly 20 to 25 percent of traffic. ATT opt-in estimates: approximately 46 to 51 percent of prompt-shown users (AppsFlyer), approximately 14 percent per-prompt (Singular), approximately 15 to 25 percent of all iOS users (Flurry).
LiveRamp Safe Haven documentation: will not distribute data identifying a group of fewer than 25 individuals. Google Ads Data Hub privacy checks: approximately 50 unique users per row, suppressed rows swept into a filtered row summary. Amazon Marketing Cloud: minimum 100 distinct users per output row. InfoSum: default rounding and redaction at 100. Google Customer Match: 100 active users.
Central Control, “How to Design a Geographic Randomized Controlled Trial” (2025): match rates “typically range from 50-60% or less. Even at 80%, this introduces too much noise to reliably detect typical advertising effects of 1-5%”; “user- and household-level targeting provides false precision”; all 210 DMAs, mutually exclusive and collectively exhaustive; intent-to-treat design declared upfront.
Average media-market area is US land area 9,147,590 km2 (CIA World Factbook) over the 210 markets the US television map defines. Nielsen’s US national TV panel covers more than 42,000 households and 101,000 directly measured viewers (Nielsen, 2022).
Jay Friedman, public LinkedIn post, August 6, 2026: the traditional Nielsen buyer and the traditional DoubleVerify buyer “aren’t the same, and probably aren’t even on the same team,” and go-to-market is the big challenge for the combined entity.
Cell counts hold fifty or more residents, computed from ACS 2020 five-year population allocated to H3 by 2020 census-block housing weights, at H3 resolutions 5, 6 and 7 (published average cell areas 252.9, 36.1 and 5.2 km2). Carried unchanged from the two prior posts in this thread.
The Ad Context Protocol review settled its base time unit as the UTC hour, with the broadcast day as a declared, versioned conversion, on July 27, 2026. Disclosure: I co-wrote that proposal.